Bitcoin Cash (BCH)
Bitcoin Cash Price Analysis: BCH Could Restart Rally Above $400
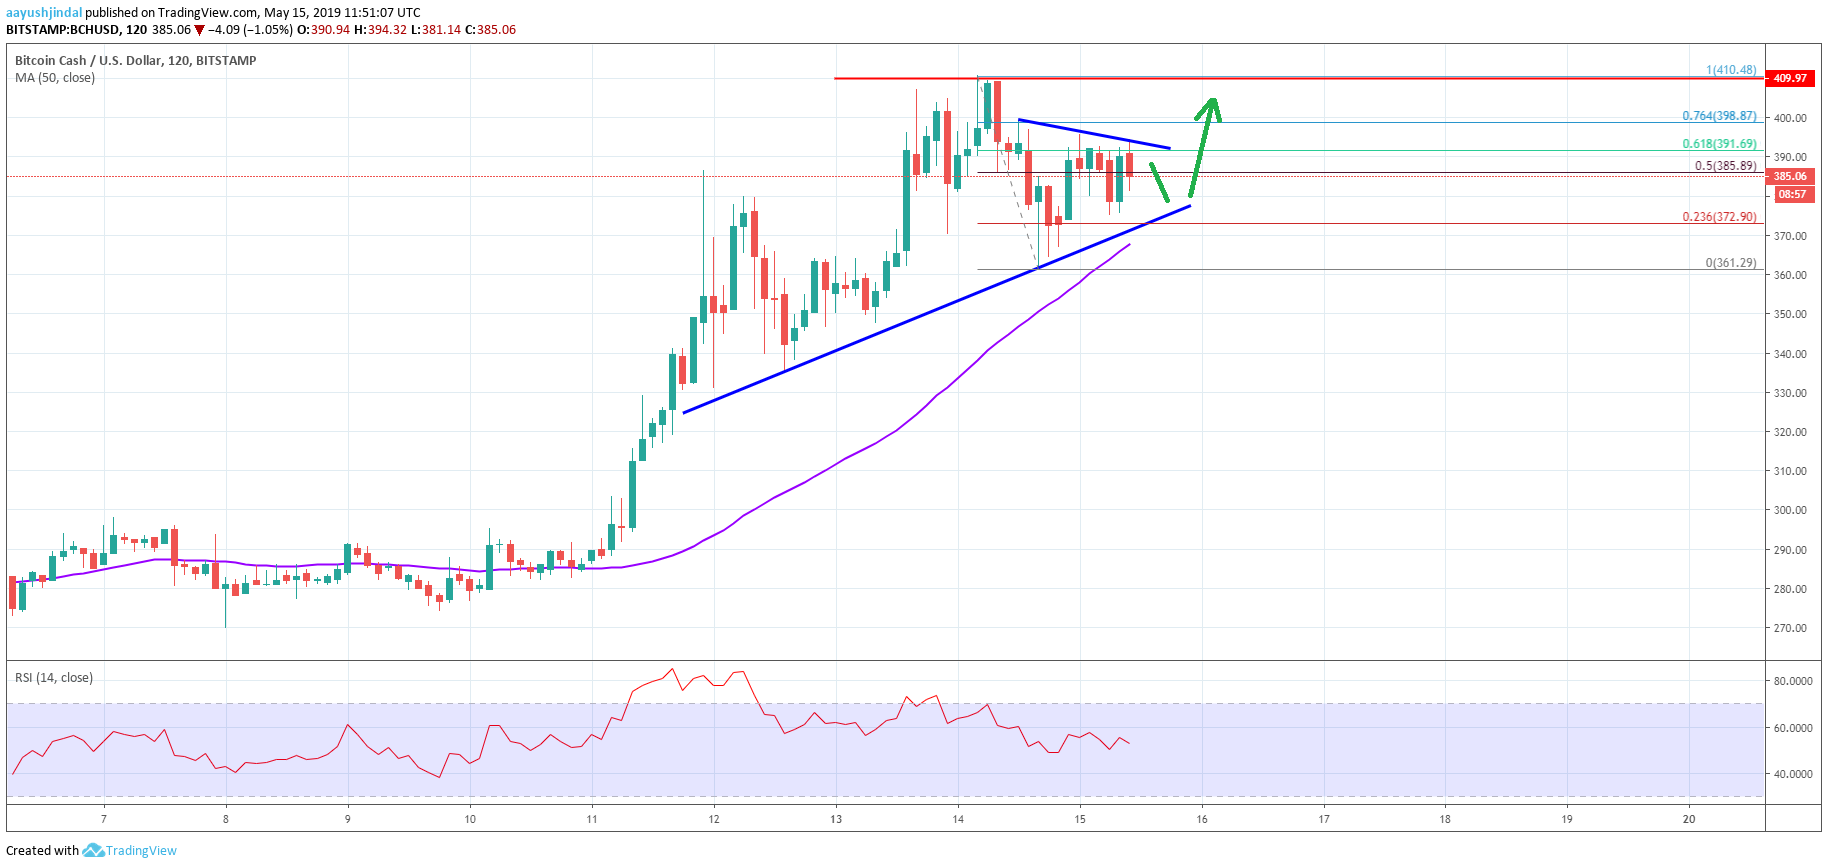
There were sharp gains in bitcoin cash price above $380.00 and $400.00. BCH to USD traded as high as $410.48 and it is currently consolidating for the next break above key supports.
Key Takeaways: BCH/USD
- Bitcoin cash price rallied as high as $410.48 before starting a downside correction against the US Dollar.
- BCH/USD is trading above the $375.00 support and a bullish trend line on the 2-hours chart (data feed from Bitstamp).
- Ethereum is up 10% above $225.00 and ripple gained momentum above the $0.4250 level.
Bitcoin Cash Price Analysis
After a strong rise in bitcoin price, bitcoin cash also started a solid upward move above the $350.00 and $380.00 resistance levels. The upward move was such that BCH price broke the $400.00 barrier and traded to a new 2019 high at $410.48.
Looking at the 2-hours chart, bitcoin cash started a downside correction after trading as high as $410.48, but stayed well above the 50 simple moving average (2-hours, purple).
There was a break below the $385.00 support and the $370.00 pivot level. However, the price stayed above the $360.00 support and the 50 simple moving average (2-hours, purple). A swing low was formed at $361.29 before the price started a fresh increase.
It climbed back above the $385.00 level and the 50% Fib retracement level of the slide from $401.48 to $361.29. However, it seems like the $392.00 and $395.00 levels are currently acting as hurdles for the bulls.
Besides, the price is struggling to clear the 61.8% Fib retracement level of the slide from $401.48 to $361.29. There is also a connecting bearish trend line forming with current resistance near $392.90 on the same chart.
A successful break above the trend line and $395.00 is likely to open the gates for a push above the $400.00 barrier. In this case, the price could surge above the $410.00 and $415.00 levels.
Conversely, if bitcoin cash price declines again, it could find support near $375.00 or a bullish trend line on the same chart. Below the trend line support, the 50 SMA could hold losses near $370.00. Finally, a successful close below $370.00 might start a strong decline back to $350.00. Overall, BCH is placed nicely above the $375.00 support and it is likely to surge above $400.00 once again.

Bitcoin Price Starting to Recover After Sharp Drop; Top Alts Ethereum and Litecoin Are Struggling

Bitcoin (BTC), Ethereum (ETH), and Litecoin (LTC) Price Prediction for Today’s Top Cryptocurrencies

Ripple Price Analysis: XRP/USD Primed For Further Gains

Bitcoin Price Analysis: BTC Surging, Next Stop Could Be $9,750

Ethereum Price Analysis: ETH Approaching Significant Support Area

Bitcoin Price Analysis: BTC Setting Up For Another Bull Run

Crypto Media Site CCN Announces It’s Shutting Down After Latest Google Update

Bitcoin (BTC), Ethereum (ETH), Litecoin (LTC) and Bitcoin Cash (BCH) Price Analysis June 10th

Facebook and the CFTC Discuss The Future of the GlobalCoin
