Ripple (XRP)
Ripple Price Analysis: Dips in XRP/USD Remains Attractive To Bulls
Ripple corrected lower sharply from the $0.4790 level and traded towards the $0.3500 level. XRP to USD is currently trading above key supports and it could climb above the $0.4050 and $0.4180.
Key Takeaways: XRP/USD
- Ripple price is showing positive signs above the $0.3800 and $0.3610 support levels against the US Dollar.
- XRP/USD is currently trading below the key $0.4100 resistance and a bearish trend line on the 2-hours chart (data feed from Bitstamp).
- Bitcoin price is consolidating below the $8,000 level and Ethereum price is holding the $245.00 support.
Ripple Price Analysis
This past week, bitcoin price climbed higher sharply above $8,000, helping ripple price above the $0.3500 and $0.3800 resistance levels. XRP even surged above the $0.4200 and traded close to the $0.4800 level. A swing high was formed at $0.4797 and recently corrected lower sharply.
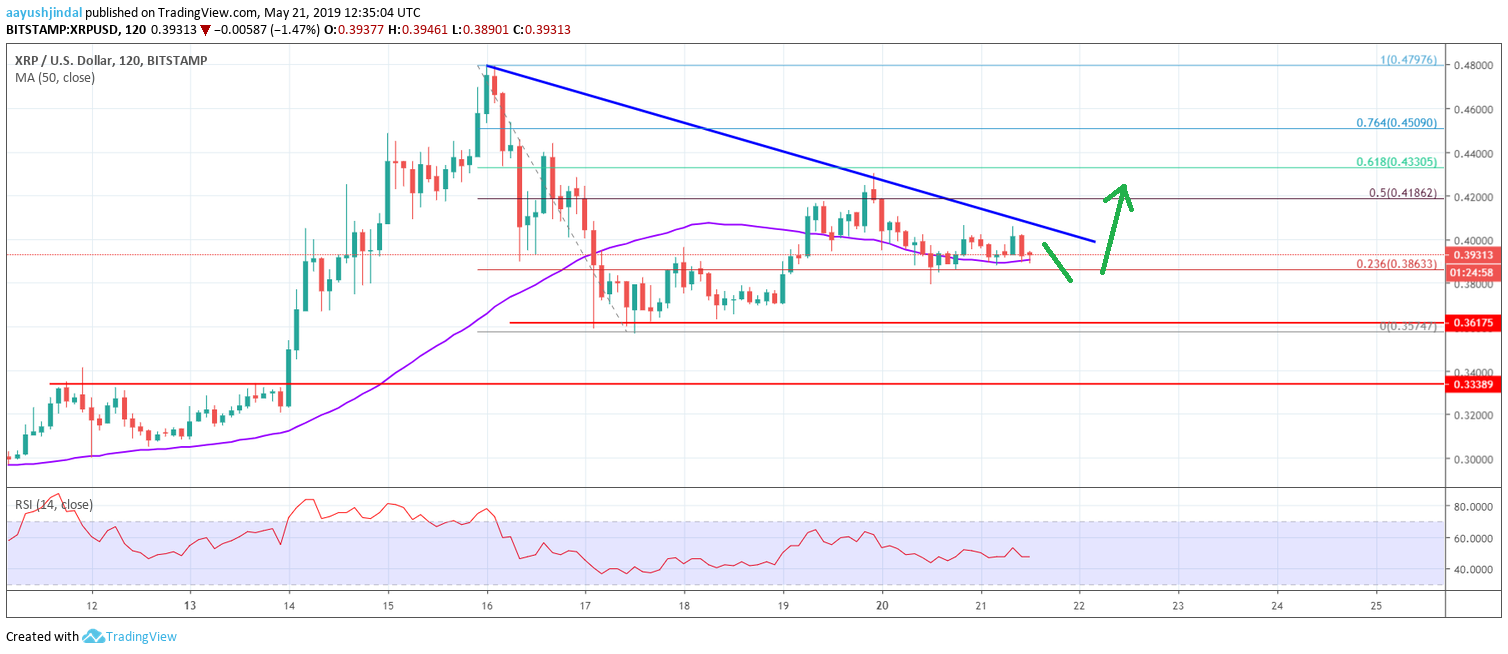
Looking at the 2-hours chart, ripple price declined below the $0.4200 and $0.4000 support levels. There was even a break below the $0.3800 support and the 50 simple moving average (2-hours, purple).
The price traded as low as $0.3574 and recently started a fresh increase. It climbed above the $0.3800 level and the 23.6% Fib retracement level of the drop from $0.4797 to $0.3574. The price even climbed above the $0.4100 level and the 50 simple moving average (2-hours, purple).
However, the recent upward move was capped by the $0.4200 level and the 50% Fib retracement level of the drop from $0.4797 to $0.3574. Ripple is currently trading below the key $0.4100 resistance and a bearish trend line on the same chart.
If there is an upside break above the $0.4000 and $0.4100 resistance levels, there are chances of a fresh increase above the $0.4200 and $0.4300 resistance levels. The next key resistance is close to the $0.4400 and $0.4500 levels.
On the downside, an initial support is near the $0.3860 level and the 50 simple moving average (2-hours, purple). If there is downside break below the $0.3850 and $0.3800 support levels, XRP could decline heavily towards the $0.3550 support zone.
Overall, ripple price is trading positively above $0.3800 and it is likely to climb above $0.4100 and $0.4200 in the near term.
Ripple price surged higher recently above $0.4400 and $0.4600. XRP to USD is currently correcting lower, but the $0.4255 level is likely to act as a strong support and buy zone.
Key Takeaways: XRP/USD
- Ripple price traded to a new monthly high at $0.4625 and recently corrected lower against the US Dollar.
- XRP/USD is testing the $0.4320 support and a major bullish trend line on the 2-hours chart (data feed from Bitstamp).
- Bitcoin price is also correcting lower from well above $9,400 and Ethereum price is currently below $270.00.
Ripple Price Analysis
Earlier this week, bitcoin price extended gains above $9,300 and $9,400. It helped ripple and its price recently started a strong rise above the $0.4200, $0.4320 and $0.4400 resistance levels. XRP even broke the $0.4500 level and traded to a new monthly high.
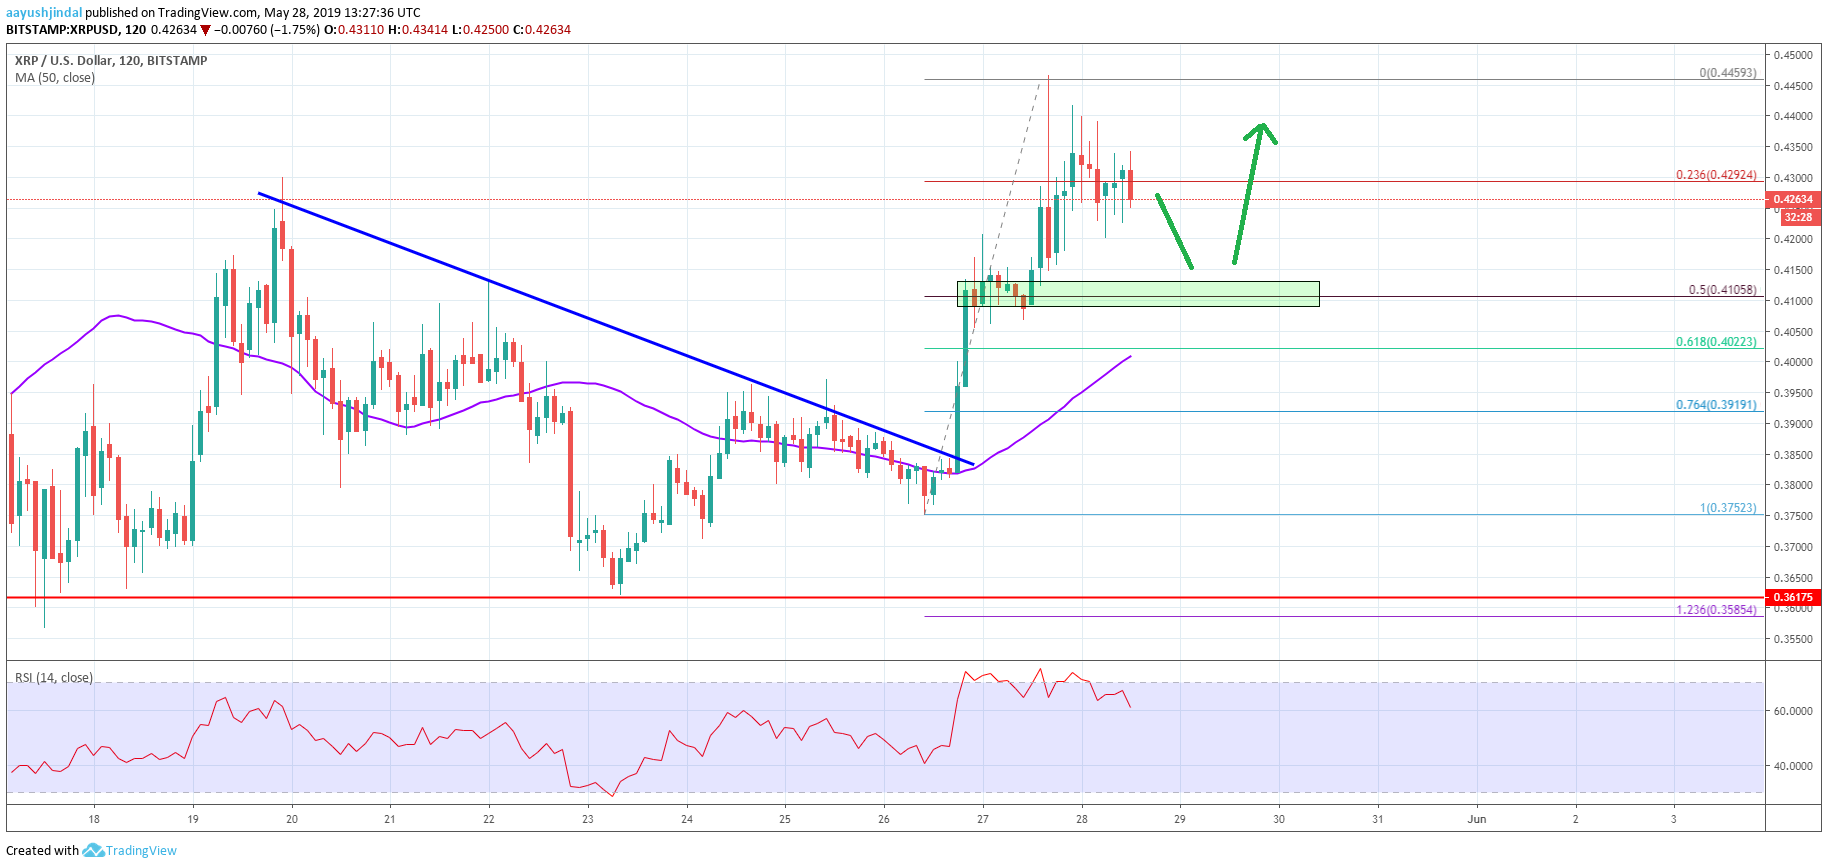
Looking at the 2-hours chart, ripple price even traded above the $0.4600 level and settled well above the 50 simple moving average (2-hours, purple). A high was formed at $0.4625 and recently, the price started a sharp downside correction.
There was a break below the $0.4520 support and the 50% Fib retracement level of the recent wave from $0.4254 to $0.4625. Moreover, the price broke the $0.4400 support level.
It is currently testing the $0.4320 support and a major bullish trend line on the 2-hours chart. The 76.4% Fib retracement level of the recent wave from $0.4254 to $0.4625 is also acting as a support.
If there is a downside break, the price could test the main support near the $0.4255 level. As long as ripple price is above $0.4255, it is likely to bounce back in the near term.
An initial resistance is near the $0.4400 level, above which ripple is likely to continue higher towards the $0.4480 and $0.4500 levels. If the bulls regain strength, XRP price could even retest the $0.4625 swing high.
Overall, ripple price is trading with a strong bullish bias above $0.4255 and $0.4150. Therefore, there are high chances of a fresh increase above the $0.4400 and $0.4480 resistance levels in the coming sessions.
Ripple rallied in the past few hours above the $0.4100 resistance area. XRP to USD is currently correcting lower, but dips are likely present a golden buying opportunity near $0.4100.
Key Takeaways: XRP/USD
- Ripple price surged higher and traded above the $0.4100 and $0.4380 resistances against the US Dollar.
- XRP/USD surpassed the main $0.3800 pivot area and a major bearish trend line on the 2-hours chart (data feed from Bitstamp).
- Bitcoin price is also correcting below $7,800 and Ethereum price is testing the $265.00 support.
Ripple Price Analysis
Earlier this week, bitcoin price gained traction above the $8,500 resistance, sparking gains in ripple price from the $0.3725 swing low. XRP started a strong upward move and broke many hurdles such as $0.3800 and $0.4000.
Looking at the 2-hours chart, ripple price surpassed the main $0.3800 pivot area and a major bearish trend line. There was even a close above the $0.4000 barrier and the 50 simple moving average (2-hours, purple).
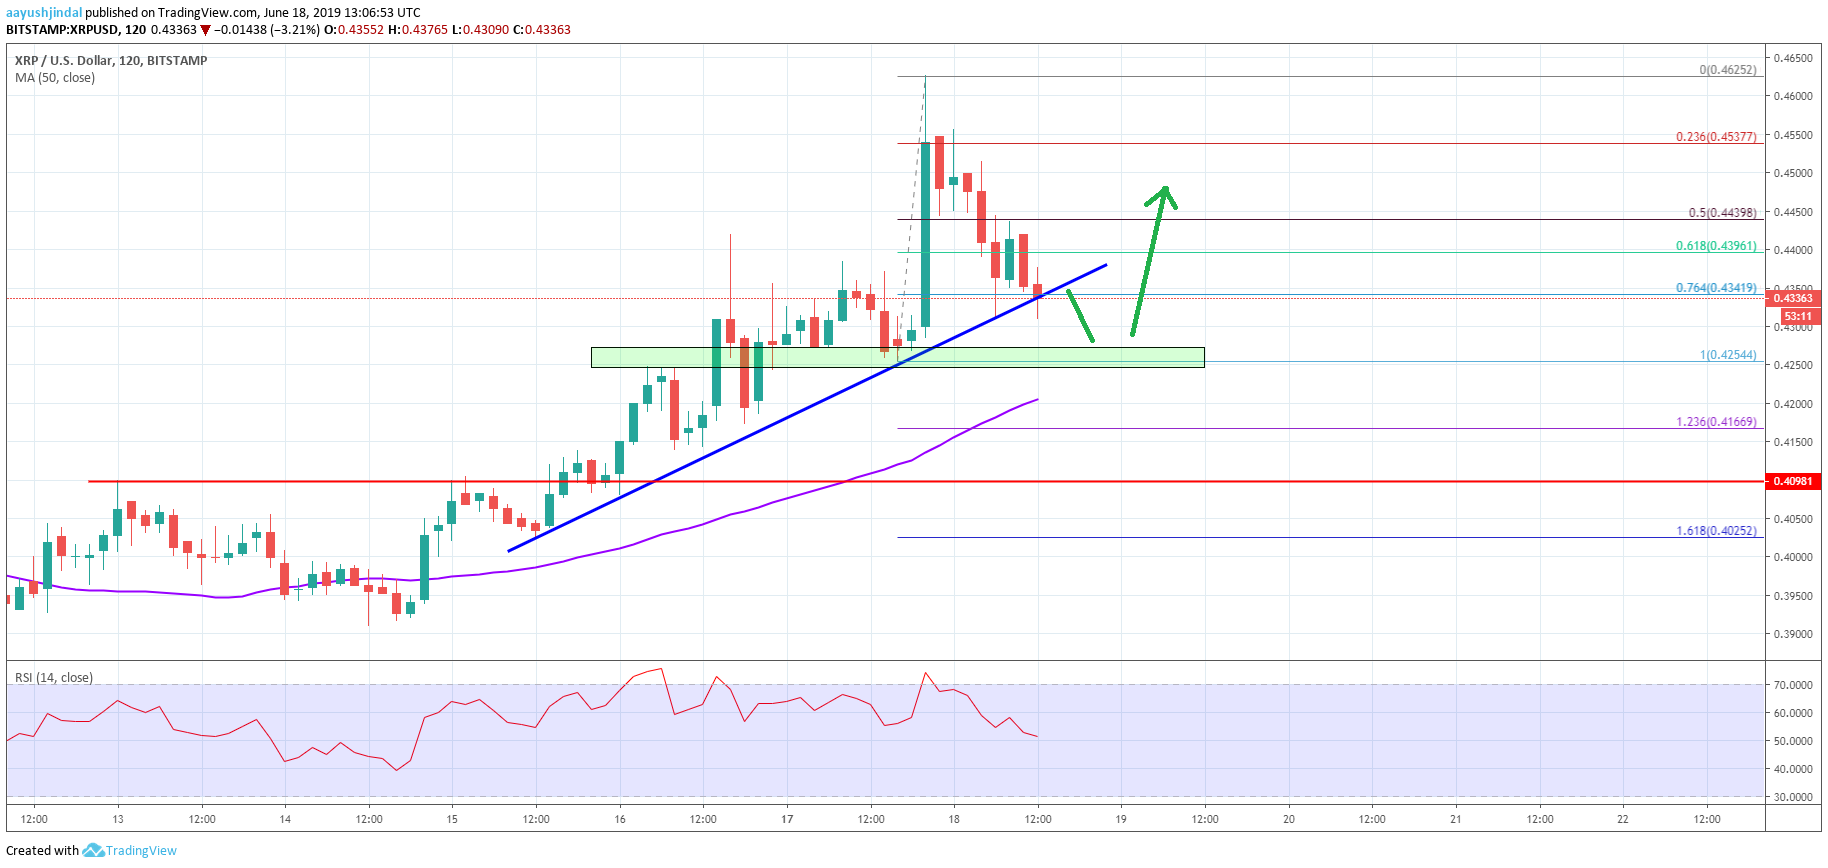
The upward move was strong considering the price surpassed the $0.4380 and $0.4400 levels. A new monthly high was formed at $0.4459 and the price is currently correcting lower. It broke the $0.4280 support plus the 23.6% Fib retracement level of the recent wave from $0.3752 to $0.4459.
However, there are many important supports on the downside near the $0.4150 and $0.4100 levels. The main support is $0.4100 since it coincides with the 50% Fib retracement level of the recent wave from $0.3752 to $0.4459.
If there is an extended correction, the next stop for the bulls could be near the $0.4010 level and the 50 simple moving average (2-hours, purple). Besides, the 61.8% Fib retracement level of the recent wave from $0.3752 to $0.4459 is also near the $0.4022 level.
Overall, ripple price is trading nicely in an uptrend above the key $0.4100 and $0.4000 support levels. In the short term, XRP could correct a few points, but dips are likely to be considered a buy opportunity unless there is a daily close below the $0.4000 support.
On the upside, the bulls are likely to target $0.4400, $0.4500 and $0.4750 in the coming days.
Finally, ripple buyers came into action after a strong rise in bitcoin price above $8,000. XRP rallied more than 20% today and surged above the $0.3650 and $0.3850 resistance levels. It may continue to climb higher towards $0.4050 and $0.4150.
Key Takeaways: XRP/USD
- Ripple price climbed higher sharply above the $0.3550 and $0.3850 levels against the US Dollar.
- XRP/USD is currently trading inside a triangle pattern with support near $0.3680 on the 2-hours chart (data feed from Bitstamp).
- Bitcoin price surged above $8,250 and Ethereum price climbed above $205.00 today.
Ripple Price Analysis
Despite a strong rise in bitcoin price in the past few days, ripple price struggled to gain bullish momentum. However, XRP bulls finally came into action today, pushing the price up more than 20%. The price rallied above the $0.3550 resistance level to move into a strong uptrend.
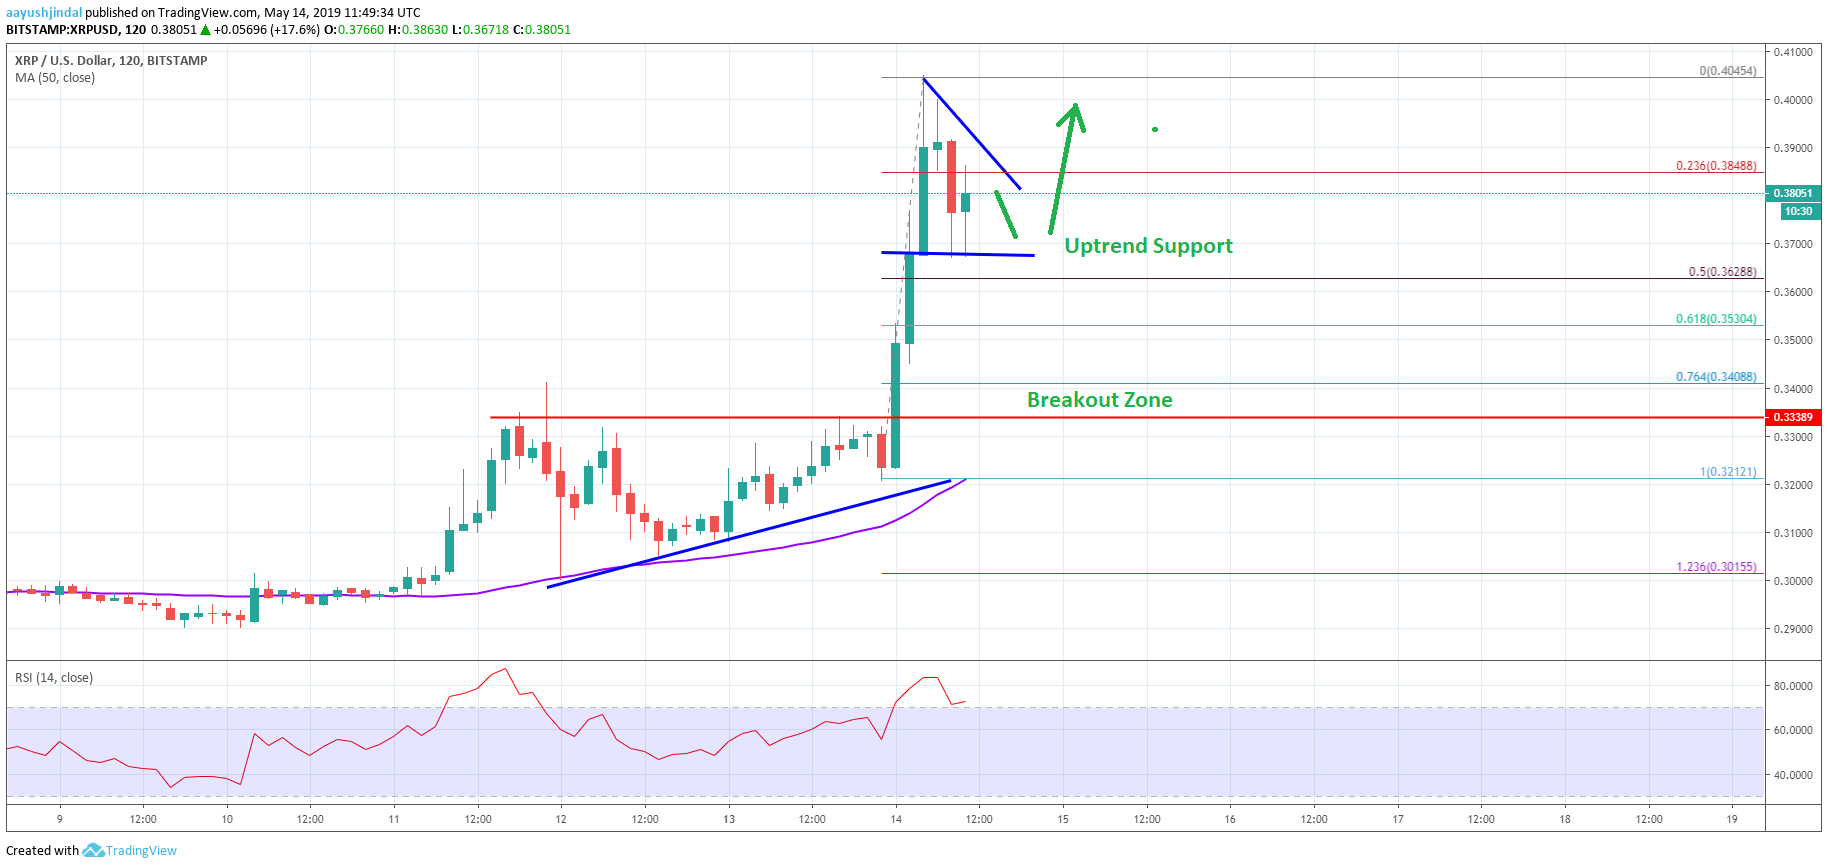
Looking at the 2-hours chart, ripple price formed a decent base near the $0.3060 level and settled above the 50 simple moving average (2-hours, purple). It opened the doors for a strong rally and the price broke the $0.3280 resistance level.
More importantly, the price climbed above the key $0.3340 resistance level to start a strong rise. There were back-to-back green candle, with a large body. The price even broke the $0.3550 and $0.3850 resistance levels.
The upward move was such that the price even spiked above the $0.4000 level and traded as high as $0.4045. Recently, the price corrected lower below $0.3850 and the 23.6% Fib retracement level of the rally from $0.3212 to $0.4045.
However, the $0.3650 level acted as a strong support and the price remained well above the 50% Fib retracement level of the rally from $0.3212 to $0.4045.
At the moment, the price is trading inside a triangle pattern with support near $0.3680 on the same chart. The triangle resistance is at $0.3880, above which ripple price is likely to start a fresh increase towards $0.4000 or even $0.4150 in the near term.
On the downside, the main supports are near $0.37000 and $0.3650, below which XRP could retest the $0.3550 support level.

Bitcoin Price Starting to Recover After Sharp Drop; Top Alts Ethereum and Litecoin Are Struggling

Bitcoin (BTC), Ethereum (ETH), and Litecoin (LTC) Price Prediction for Today’s Top Cryptocurrencies

Ripple Price Analysis: XRP/USD Primed For Further Gains

Bitcoin Price Analysis: BTC Surging, Next Stop Could Be $9,750

Ethereum Price Analysis: ETH Approaching Significant Support Area

Bitcoin Price Analysis: BTC Setting Up For Another Bull Run

Crypto Media Site CCN Announces It’s Shutting Down After Latest Google Update

Bitcoin (BTC), Ethereum (ETH), Litecoin (LTC) and Bitcoin Cash (BCH) Price Analysis June 10th

Facebook and the CFTC Discuss The Future of the GlobalCoin
