Altcoin News
Ripple Price Analysis: XRP Rallies 20%, Can Bulls Remain In Control?
Finally, ripple buyers came into action after a strong rise in bitcoin price above $8,000. XRP rallied more than 20% today and surged above the $0.3650 and $0.3850 resistance levels. It may continue to climb higher towards $0.4050 and $0.4150.
Key Takeaways: XRP/USD
- Ripple price climbed higher sharply above the $0.3550 and $0.3850 levels against the US Dollar.
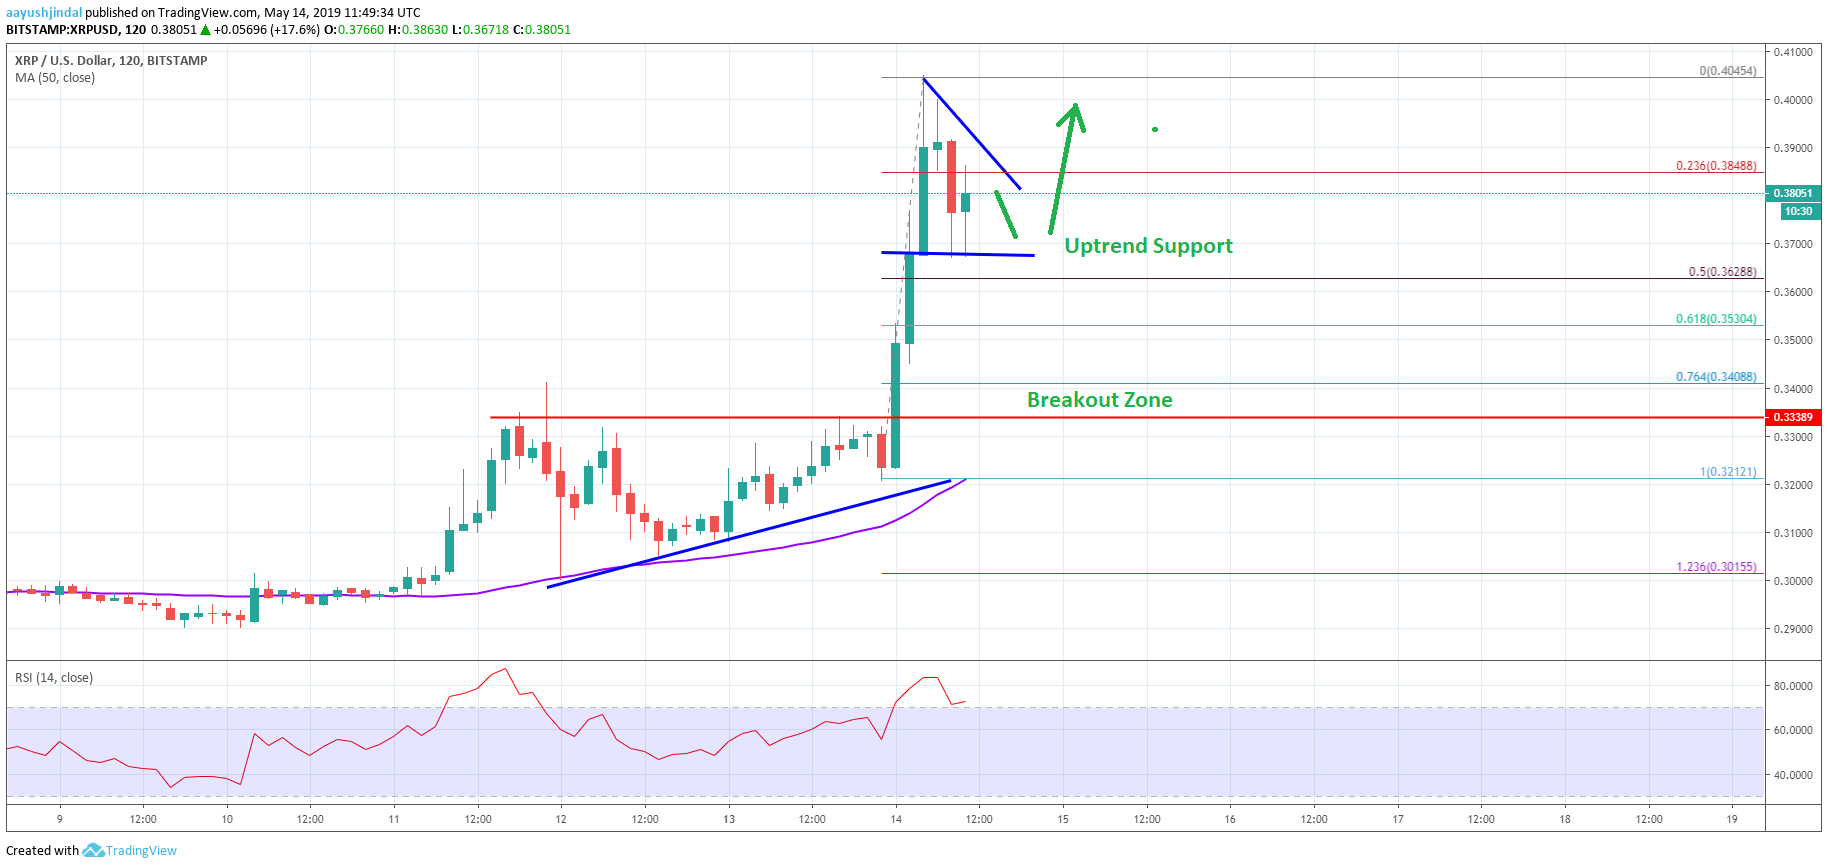
- XRP/USD is currently trading inside a triangle pattern with support near $0.3680 on the 2-hours chart (data feed from Bitstamp).
- Bitcoin price surged above $8,250 and Ethereum price climbed above $205.00 today.
Ripple Price Analysis
Despite a strong rise in bitcoin price in the past few days, ripple price struggled to gain bullish momentum. However, XRP bulls finally came into action today, pushing the price up more than 20%. The price rallied above the $0.3550 resistance level to move into a strong uptrend.
Looking at the 2-hours chart, ripple price formed a decent base near the $0.3060 level and settled above the 50 simple moving average (2-hours, purple). It opened the doors for a strong rally and the price broke the $0.3280 resistance level.
More importantly, the price climbed above the key $0.3340 resistance level to start a strong rise. There were back-to-back green candle, with a large body. The price even broke the $0.3550 and $0.3850 resistance levels.
The upward move was such that the price even spiked above the $0.4000 level and traded as high as $0.4045. Recently, the price corrected lower below $0.3850 and the 23.6% Fib retracement level of the rally from $0.3212 to $0.4045.
However, the $0.3650 level acted as a strong support and the price remained well above the 50% Fib retracement level of the rally from $0.3212 to $0.4045.
At the moment, the price is trading inside a triangle pattern with support near $0.3680 on the same chart. The triangle resistance is at $0.3880, above which ripple price is likely to start a fresh increase towards $0.4000 or even $0.4150 in the near term.
On the downside, the main supports are near $0.37000 and $0.3650, below which XRP could retest the $0.3550 support level.

- Ethereum transactions are close to 1 million per day
- The whole network is recovering from last years’ bear market
The Ethereum (ETH) network seems to be performing very well in terms of the number of transactions that it’s currently processing. The second largest blockchain platform in the market is approaching 1 million transactions per day, according to data provided by BitInfoCharts.
Ethereum Transactions Reach New Highs
As the crypto market expands and the community changes the sentiment to positive, blockchain networks are becoming more used than before. This can be seen in Bitcoin and Ethereum. The second largest cryptocurrency has reached almost 950,000 transactions a few days ago, and the trend is clearly to the upward. However, this remains far from the 1.35 million transactions that the network registered in January 2018.
At the same time, Bitcoin transactions are reaching new highs in over a year. A few weeks ago, Bitcoin registered 452,000 transactions. However, there is a difference between Bitcoin and Ethereum. While Bitcoin transactions reached a bottom in April 2018, Ethereum network activity continued falling until almost a year later in February 2019.
Since February, the number of transactions on the Ethereum network grew by 150%. This is the same level as in February 2018 with the exception of a sudden peak in May 2018. Since February, Bitcoin transactions grew by 35%.
Ethereum is also recovering after falling below $100. This sharp decline in the price of Ethereum was related to the fact that there were several startups and Initial Coin Offerings (ICOs) selling their digital assets in order to cover operational costs. At the same time, this drop was accompanied by a price decrease in Bitcoin (BTC).
One of the fastest growing sectors of the Ethereum ecosystem is Decentralized Finance (DeFi), which consists of Ethereum-based peer-to-peer lending products such as MakerDAO or Dharma, among others.
At the time of writing this article, Ethereum is being traded around $257 and it has a market capitalization of $27.37 billion. In the last 24 hours, Ethereum lost almost 10 percent of its value due to a large drop in the price of digital assets.
Ethereum seems to be recovering from the bear market in economic terms. Its network could be processing 1 million transactions a day in the near future. This is the same value as the network registered in February 2018.
Altcoin News
Bitcoin Cash gets 51% Attacked by Just Two Miners to Reverse Transaction, Price is Unchanged

- Btc.com and BTC.top carries out a 51% attack on Bitcoin Cash network to stop an unknown miner
- BTC price down less than one percent only
Two of the Bitcoin Cash miners reportedly carried out a 51% attack on the Bitcoin Cash (BCH) blockchain in an effort to reverse another miner’s transactions, per the Tweet by Cryptoconomy Podcast host, Guy Swann on May 24th.
A 51% attack occurs when someone controls the majority of the mining power on a Proof-of-Work (PoW) blockchain network. This means the majority of the block verifiers can prevent others from mining and reverse transactions.
Controlling 50 percent of the Hash Power
Typically, it has been assumed that a 51 percent attack is carried out with malicious intent, however, this isn’t the case with Bitcoin Cash. Here, two mining pools – BTC.com and BTC.top carried out this move to stop an unknown miner from taking some coins, due to a code update. Instead of rewarding the attackers or have them for themselves, this move was for the good of the community.
Swann explained, “Since the original split in 2017, there has been a significant number of coins accidentally sent to ‘anyone can spend’ addresses (due to [transaction] compatibility of signs, but no #SegWit on #BCH), or possibly they’ve been replayed from #Bitcoin onto the #BCH network.”
The attacker that day took advantage of a bug that was unrelated to the upgrade – which was subsequently patched – that caused the Bitcoin Cash network to split and BTC.top to mine empty blocks while the bad transactions made blocks impossible to produce.
“When the unknown miner tried to take the coins themselves, [BTC.top and BTC.com] saw & immediately decided to re-organize and remove these [transactions], in favor of their own [transactions], spending the same P2SH coins, [and] many others,” Swann further said.
At one point, BTC.top controlled over 50 percent of the power by itself. However, BTC.com and BTC.top were able to join together in order to reverse the blocks of transactions. Currently, both the mining pools have a combined hash power of more than 42 percent, as per the data provided by Coin Dance.
A Good or Bad Thing?
The Bitcoin Cash community is divided on this. While some developers are quiet, others like jtoomim called it “justice” and “punishment” for “antisocial behaviour.”
Meanwhile, some like Bitcoin Cash developer that goes by the name, Kiarahpromises argues that it is bad for the blockchain and shows that BCH blockchain is centralized.
“To coordinate a reorg to revert unknown’s transactions. This is a 51% attack. The absolutely worst attack possible. It’s there in the whitepaper. What about (miner and developer) decentralized and uncensorable cash? Only when convenient?” said Kiarahpromises.
https://twitter.com/WhalePanda/status/1131979967858905088
This is certainly a matter of concern shared across proof-of-work networks. If we take a look at the bitcoin’s hashing power, according to Blockahin.com, it is divided among three mining pools only.
Currently, this attack has no effect on the price of BCH/USD as it trades at $414 with 24-hours loss of a mere 0.65 percent. BCH is up 161 percent till date, in 2019.
After Craig Wright’s drama, there was a strong rally in bitcoin SV price above $80.00 and $100.00. BSV to USD even traded towards the $135.00 level and it is currently consolidating gains for the next wave.
Key Takeaways: BSV/USD
- Bitcoin SV price surged above $100.00 and doubled in value against the US Dollar.
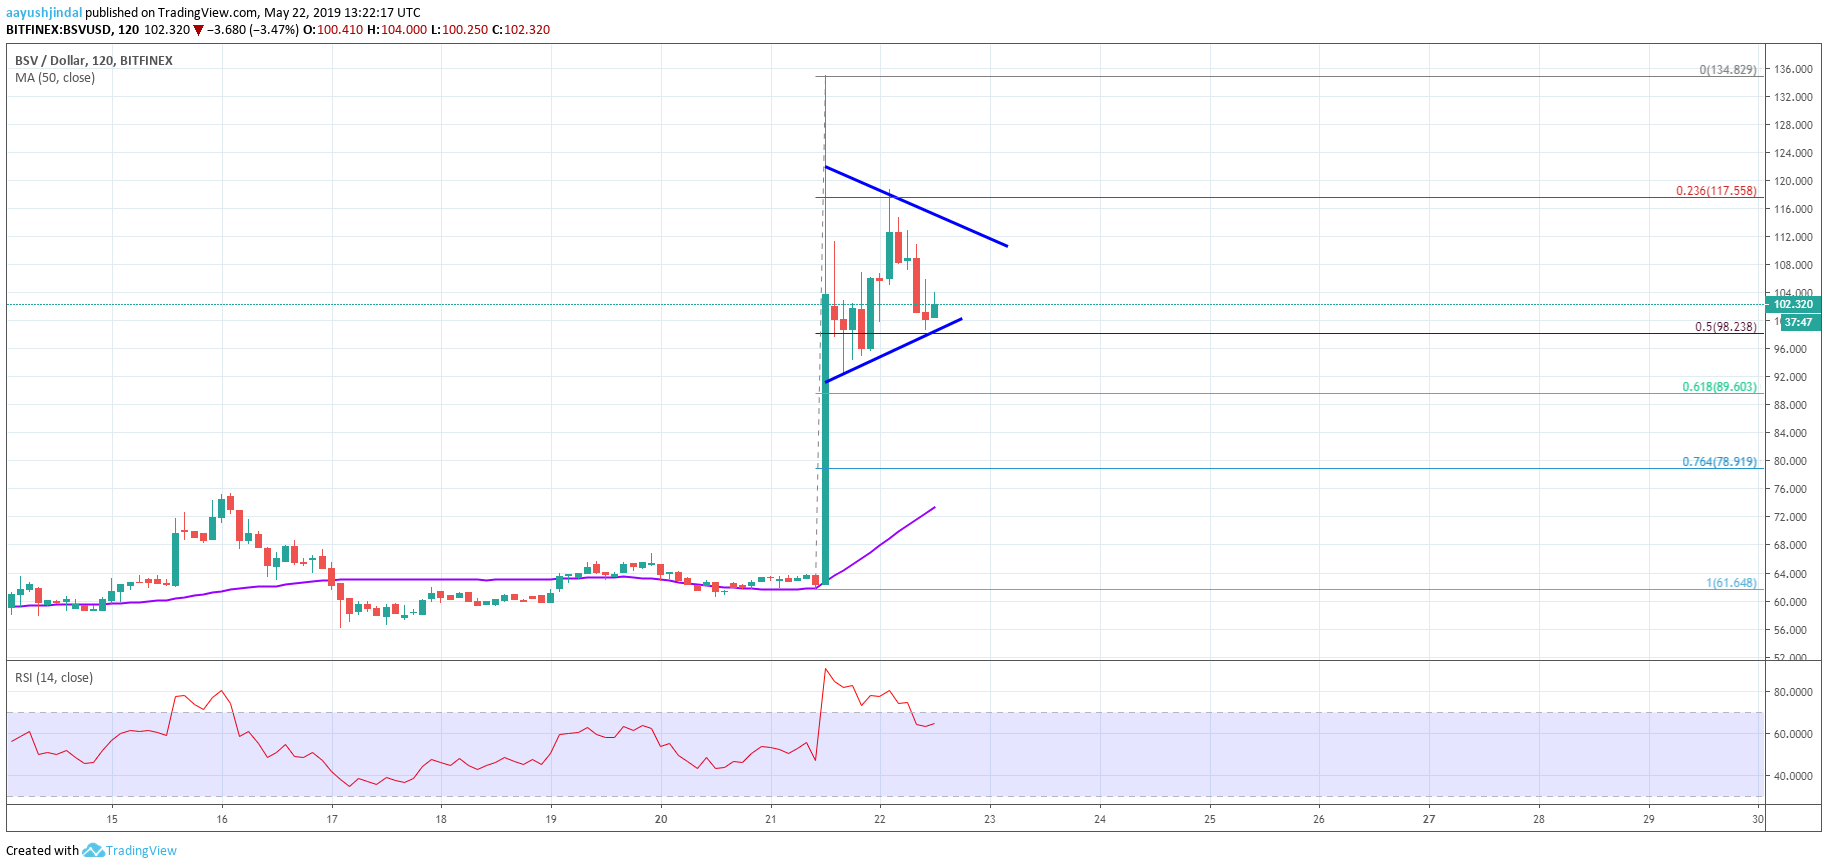
- BSV/USD is currently trading inside a contracting triangle with support near $98.00 on the 2-hours chart (data feed from Bitfinex).
- Bitcoin price is down around 1% to $7,800 and ripple price is struggling below the $0.4000 barrier.
Bitcoin SV Price Analysis
Recently, Craig Wright filed registrations with the U.S. Copyright Office to claim authorship over the original bitcoin code and the Satoshi white paper. It sparked a sharp upward move in bitcoin SV price from the $60.00 support area.
Looking at the 2-hours chart, bitcoin SV climbed higher significantly and broke many resistances such as $80.00, $85.00 and even $100.00. There was a close above the $100.00 level and the 50 simple moving average (2-hours, purple).
BSV price rallied above the $125.00 level and traded as high as $134.82. Recently, it started a downside correction and traded below the $120.00 level and the 23.6% Fib retracement level of the recent rally from $61.64 to $134.82.
However, the $100.00 level along with the 50% Fib retracement level of the recent rally from $61.64 to $134.82 are currently acting as a support. Moreover, the price is trading inside a contracting triangle with support near $98.00 on the same chart.
If there is a downside break below the $100.00 and $98.00 levels, the price could extend the correction towards the $88.00 level or the 61.8% Fib retracement level of the recent rally from $61.64 to $134.82.
On the other hand, bitcoin SV could start a fresh increase above the $105.00 and $110.00 levels. However, a successful close above the $120.00 level is needed for a strong rally in BSV in the near term.
The next key resistance is near the $135.00 level, above which bitcoin SV might climb towards the $150.00 barrier. On the downside, the main supports are near $98.00, $88.00 and $82.00.

Bitcoin Price Starting to Recover After Sharp Drop; Top Alts Ethereum and Litecoin Are Struggling

Bitcoin (BTC), Ethereum (ETH), and Litecoin (LTC) Price Prediction for Today’s Top Cryptocurrencies

Ripple Price Analysis: XRP/USD Primed For Further Gains

Bitcoin Price Analysis: BTC Surging, Next Stop Could Be $9,750

Ethereum Price Analysis: ETH Approaching Significant Support Area

Bitcoin Price Analysis: BTC Setting Up For Another Bull Run

Crypto Media Site CCN Announces It’s Shutting Down After Latest Google Update

Bitcoin (BTC), Ethereum (ETH), Litecoin (LTC) and Bitcoin Cash (BCH) Price Analysis June 10th

Facebook and the CFTC Discuss The Future of the GlobalCoin
